pycohortflow#
Lightweight cohort flow diagrams built on Matplotlib.
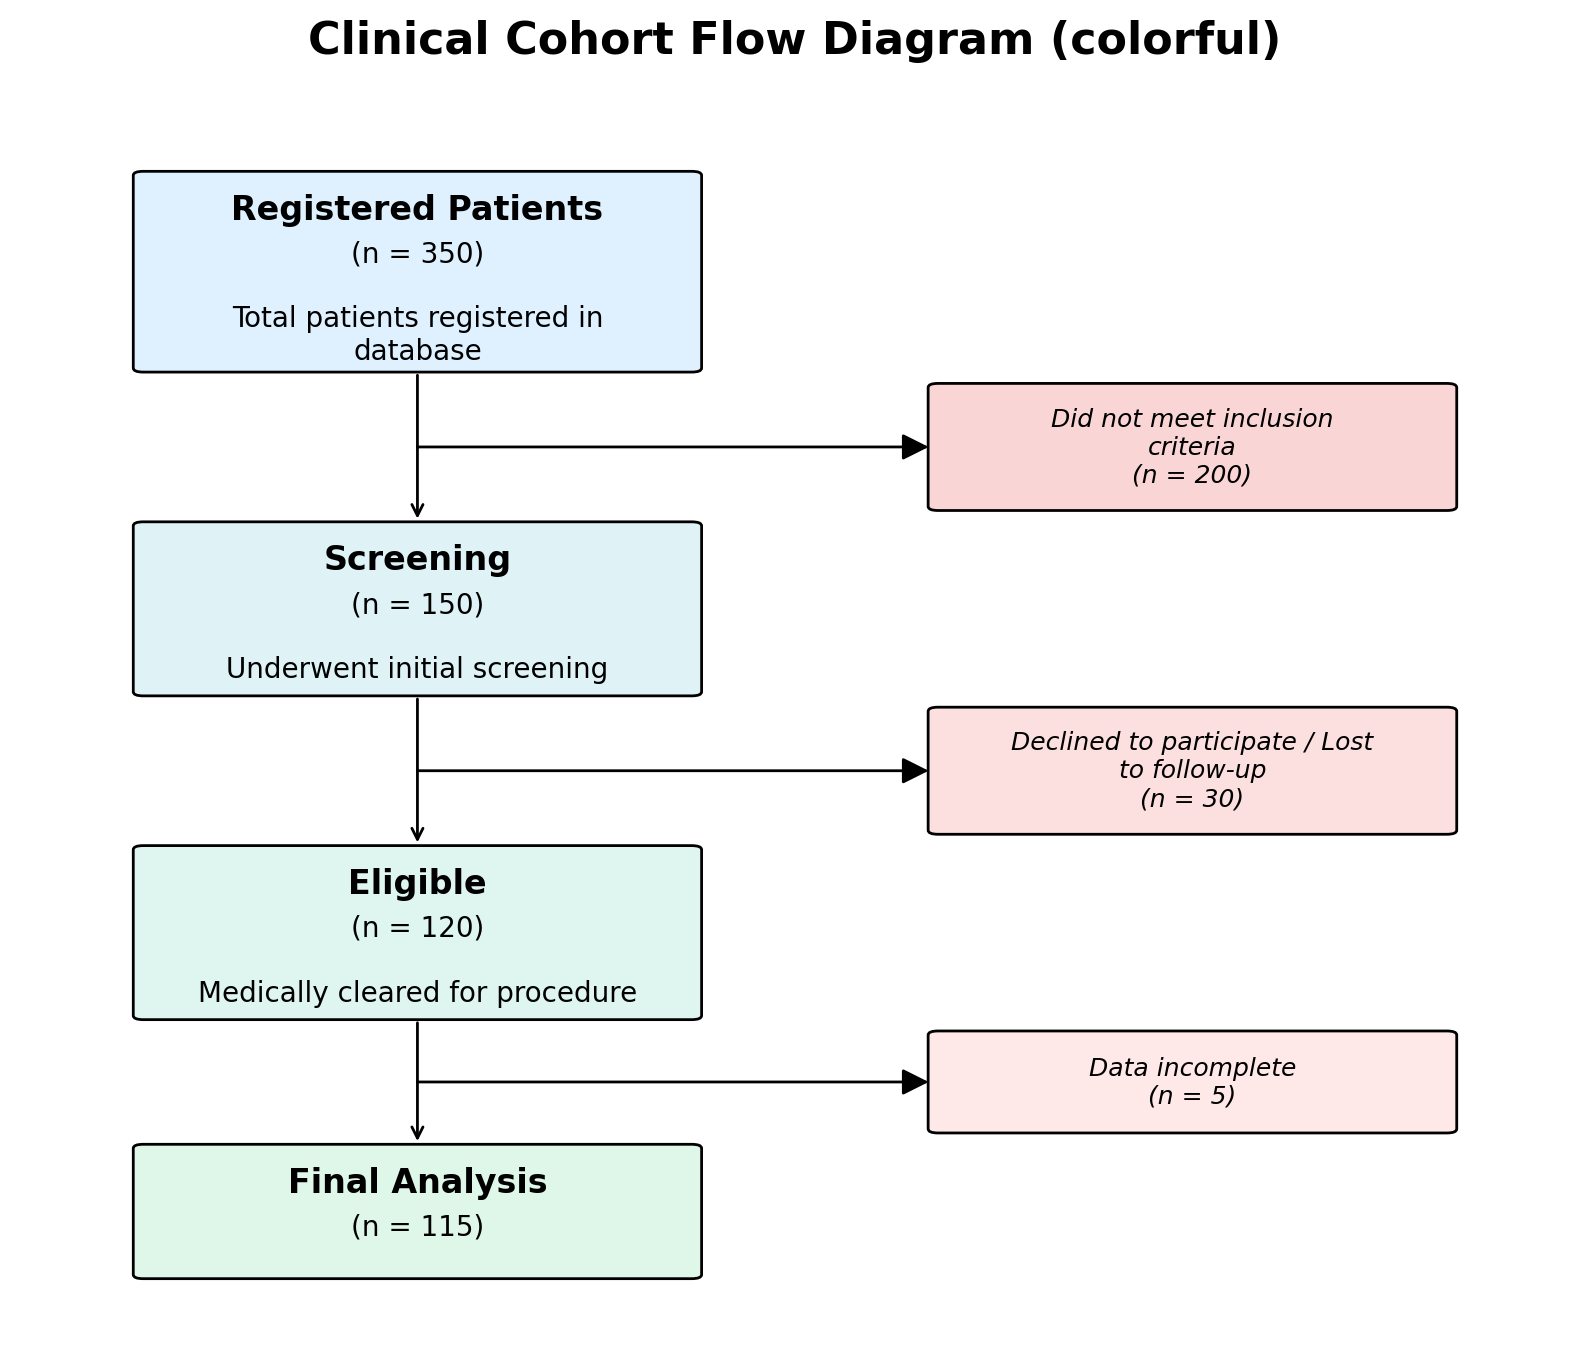
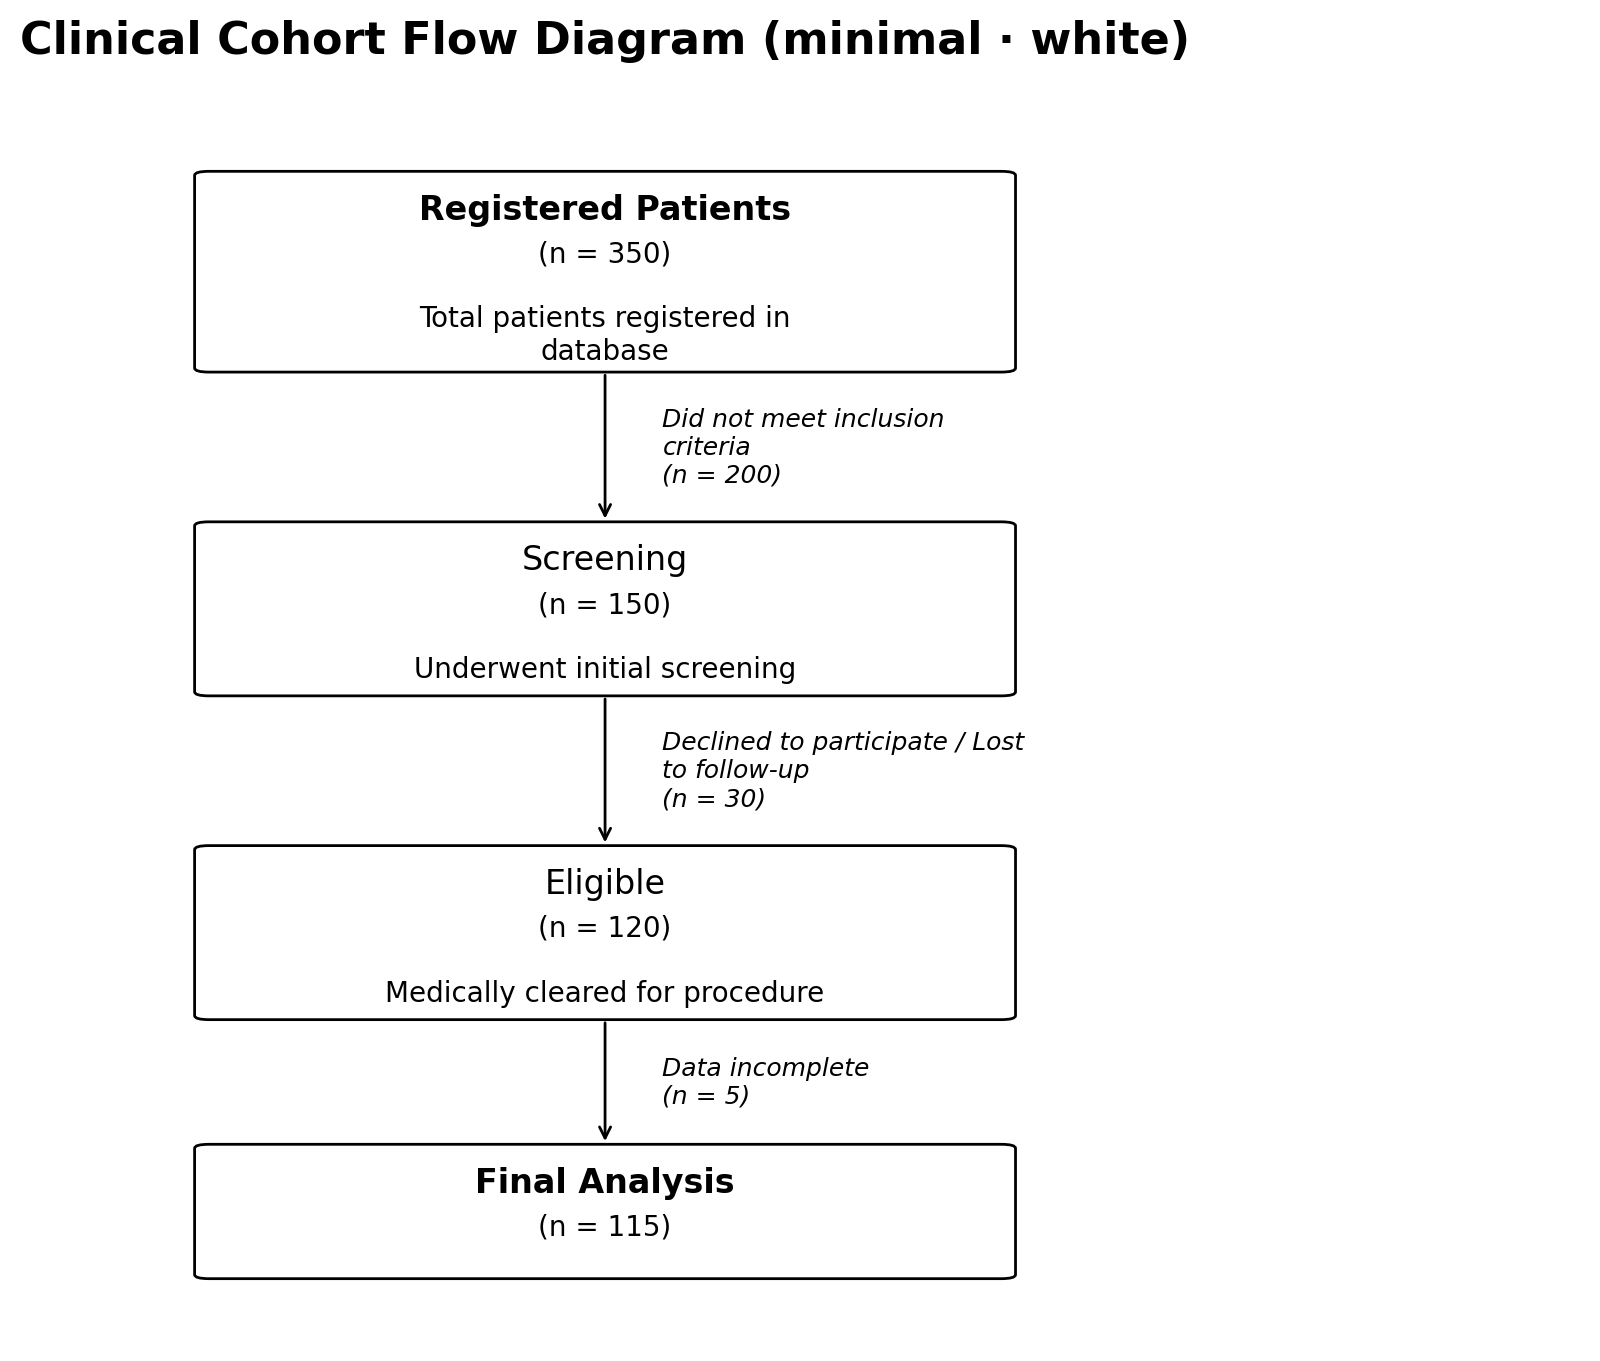
pycohortflow lets you turn a plain Python list into a publication-ready
vertical flow chart in a single function call. Colours, fonts, spacing,
and box geometry are fully customisable through TOML configuration files.
Don’t want to install anything? Use the Interactive Generator to build diagrams directly in your browser and export them as SVG, PNG or PDF.
Interactive Generator
- Try it in the browser — build diagrams without installing Python
Quickstart#
from pycohortflow import plot_cfd

data = [
    {"heading": "Registered", "N": 350},
    {"heading": "Screened", "N": 150,
     "exclusion_description": "Not eligible"},
    {"heading": "Analysed", "N": 120,
     "exclusion_description": "Lost to follow-up"},
]

fig, ax = plot_cfd(data, figure_title="My Study")
Documentation
- Getting Started — installation, quick example, data format
- Customise — built-in styles, TOML configuration, overrides
- Development — local setup, testing, deployment
Python API
- Python API — full API documentation
- cfd — Plotting —
plot_cfd - cfd_util — Utilities — colours, config, helpers
Citing pycohortflow#
If you use pycohortflow in your work, please cite both the
descriptive paper and the specific software version you used. The
two serve different purposes:
Paper — describes the methodology, design rationale, and intended use cases. Cite this so readers can find and understand what
pycohortflowis:Schwarz, F. (2026). pycohortflow: Lightweight, customisable cohort flow diagrams in Python and JavaScript. MetaArXiv. https://doi.org/10.31222/osf.io/ncya2
Software version — pins the exact code that produced your figures. Cite this so readers can reproduce your analysis. The Zenodo link below is the concept DOI, which always resolves to the latest archived version; from there, open the Versions panel and pick the version DOI that matches the release you actually used:
Schwarz, Friedrich. Pycohortflow. Zenodo, 2026. https://doi.org/10.5281/zenodo.20052730