Getting Started#
Installation#
Install from PyPI with pip:
pip install pycohortflow
The only hard dependency is Matplotlib (>= 3.5). On Python versions
before 3.11, the lightweight tomli package is pulled in automatically so
that TOML configuration files work out of the box.
Quick Example#
Create a Python script or Jupyter notebook and paste the following:
from pycohortflow import plot_cfd
import matplotlib.pyplot as plt

cohort_data = [
    {
        "heading": "Registered Patients",
        "description": "Total patients registered in database",
        "N": 350,
    },
    {
        "heading": "Screening",
        "description": "Underwent initial screening",
        "N": 150,
        "exclusion_description": "Did not meet inclusion criteria",
    },
    {
        "heading": "Eligible",
        "description": "Medically cleared for procedure",
        "N": 120,
        "exclusion_description": "Declined to participate / Lost to follow-up",
    },
    {
        "heading": "Final Analysis",
        "N": 115,
        "exclusion_description": "Data incomplete",
    },
]

fig, ax = plot_cfd(
    cohort_data,
    figure_title="Clinical Cohort Flow Diagram",
)
plt.show()
This produces a vertical flow chart with automatic exclusion counts and
connecting arrows. The default "white" style renders clean white boxes:
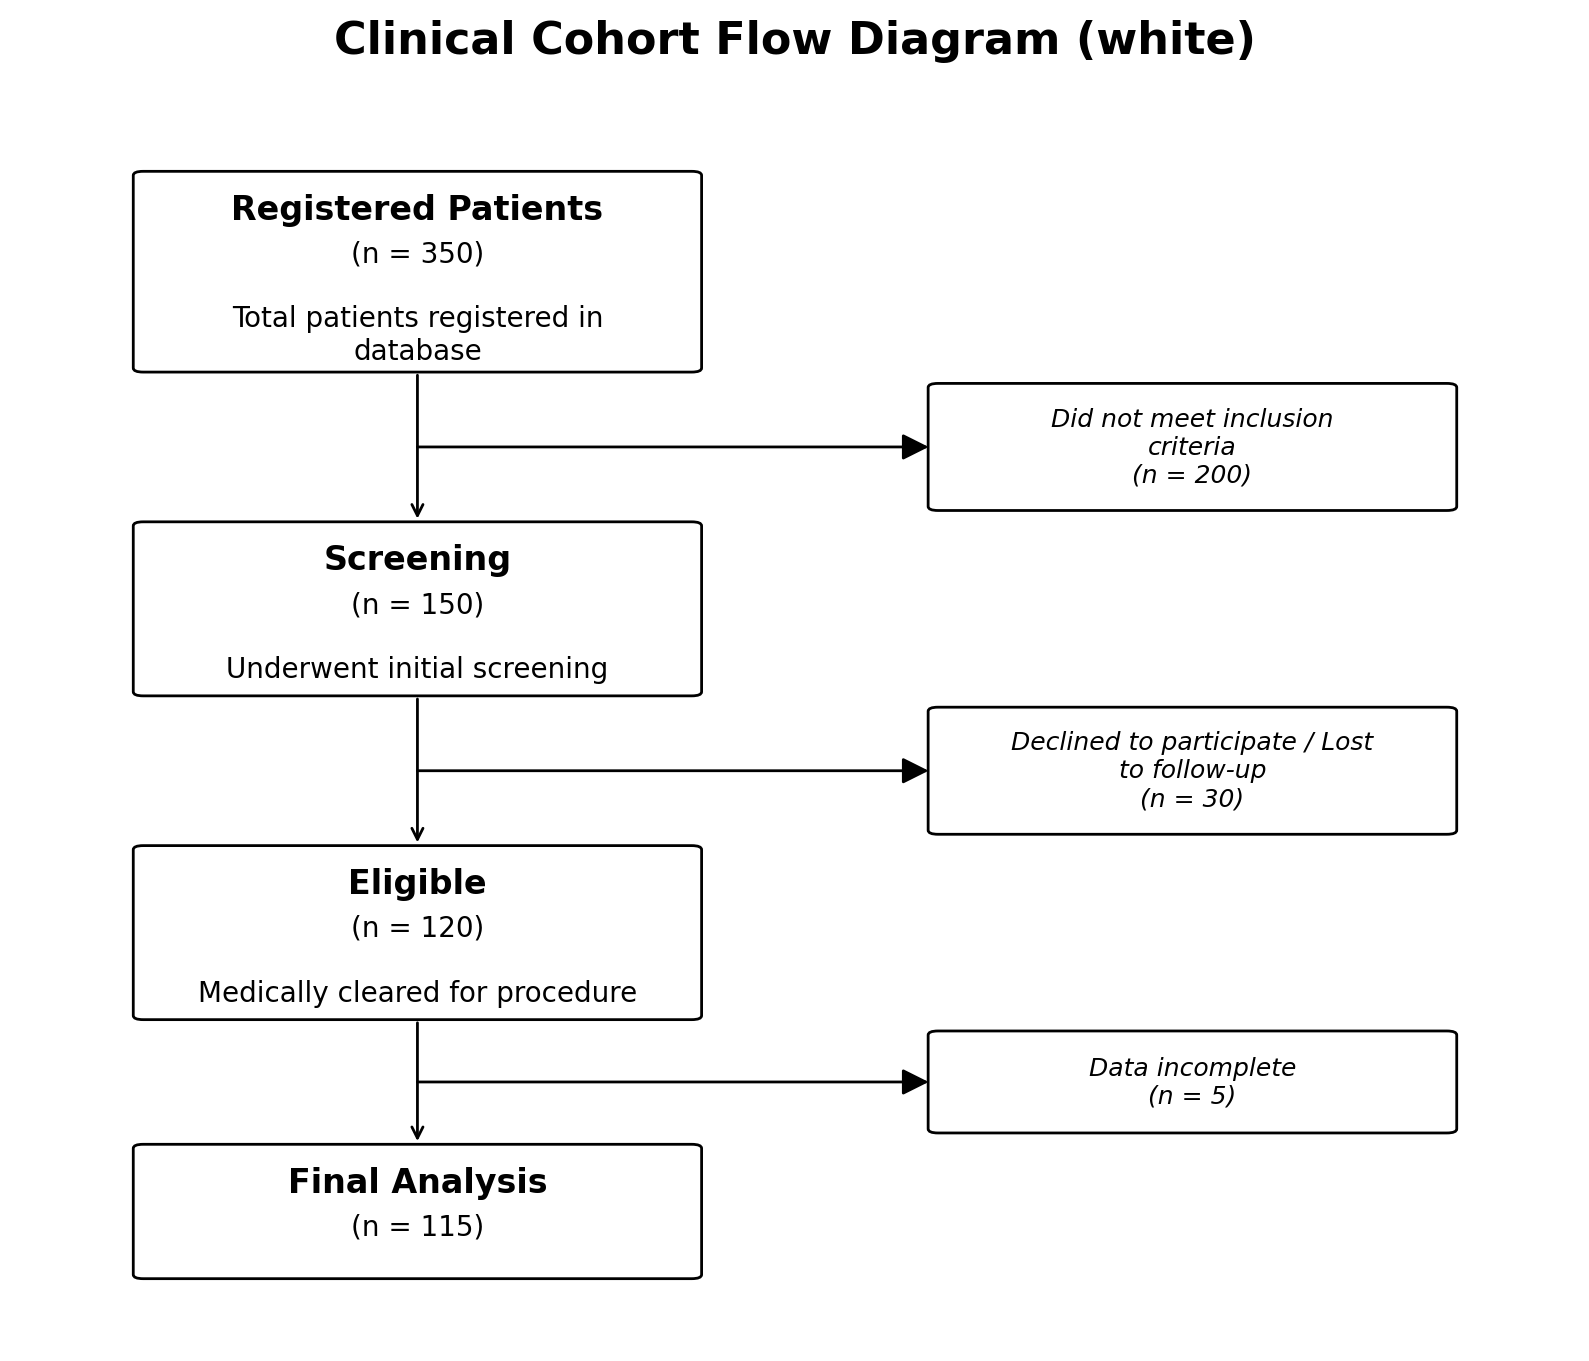
Output using the default style="white".#
Choosing a Built-in Style#
Three styles are bundled with the package:
# Clean white boxes (default)
fig, ax = plot_cfd(cohort_data, style="white")

# Pastel gradient backgrounds
fig, ax = plot_cfd(cohort_data, style="colorful")

# Minimal: white boxes, normal-weight headings, italic side text
# in place of an exclusion box.  Use per-node ``"color"`` and
# ``"heading_fontweight": "bold"`` overrides to highlight the
# first and last steps.
fig, ax = plot_cfd(cohort_data, style="minimal")

# Transparent figure background (useful for slides or posters)
fig, ax = plot_cfd(cohort_data, transparent=True)
The "colorful" style applies pastel gradients to all boxes:
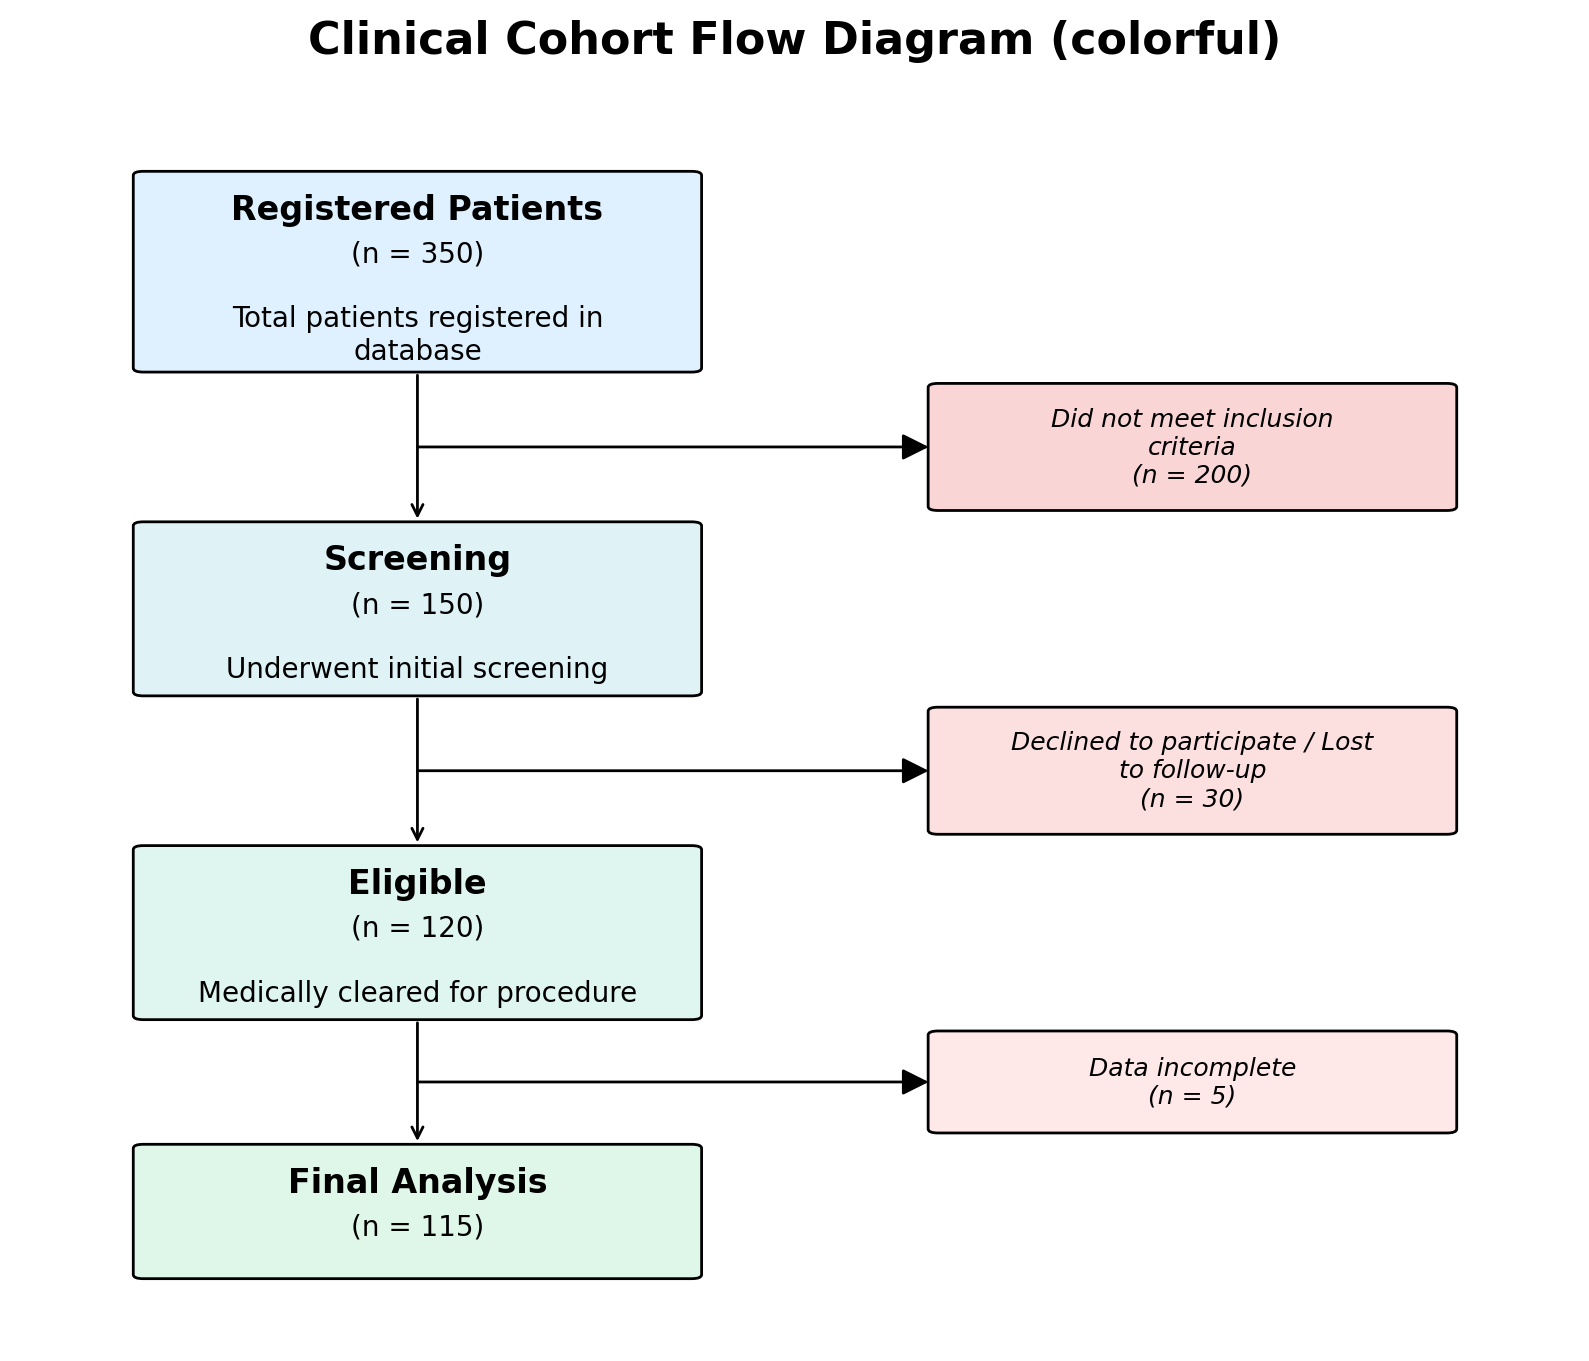
Output using style="colorful".#
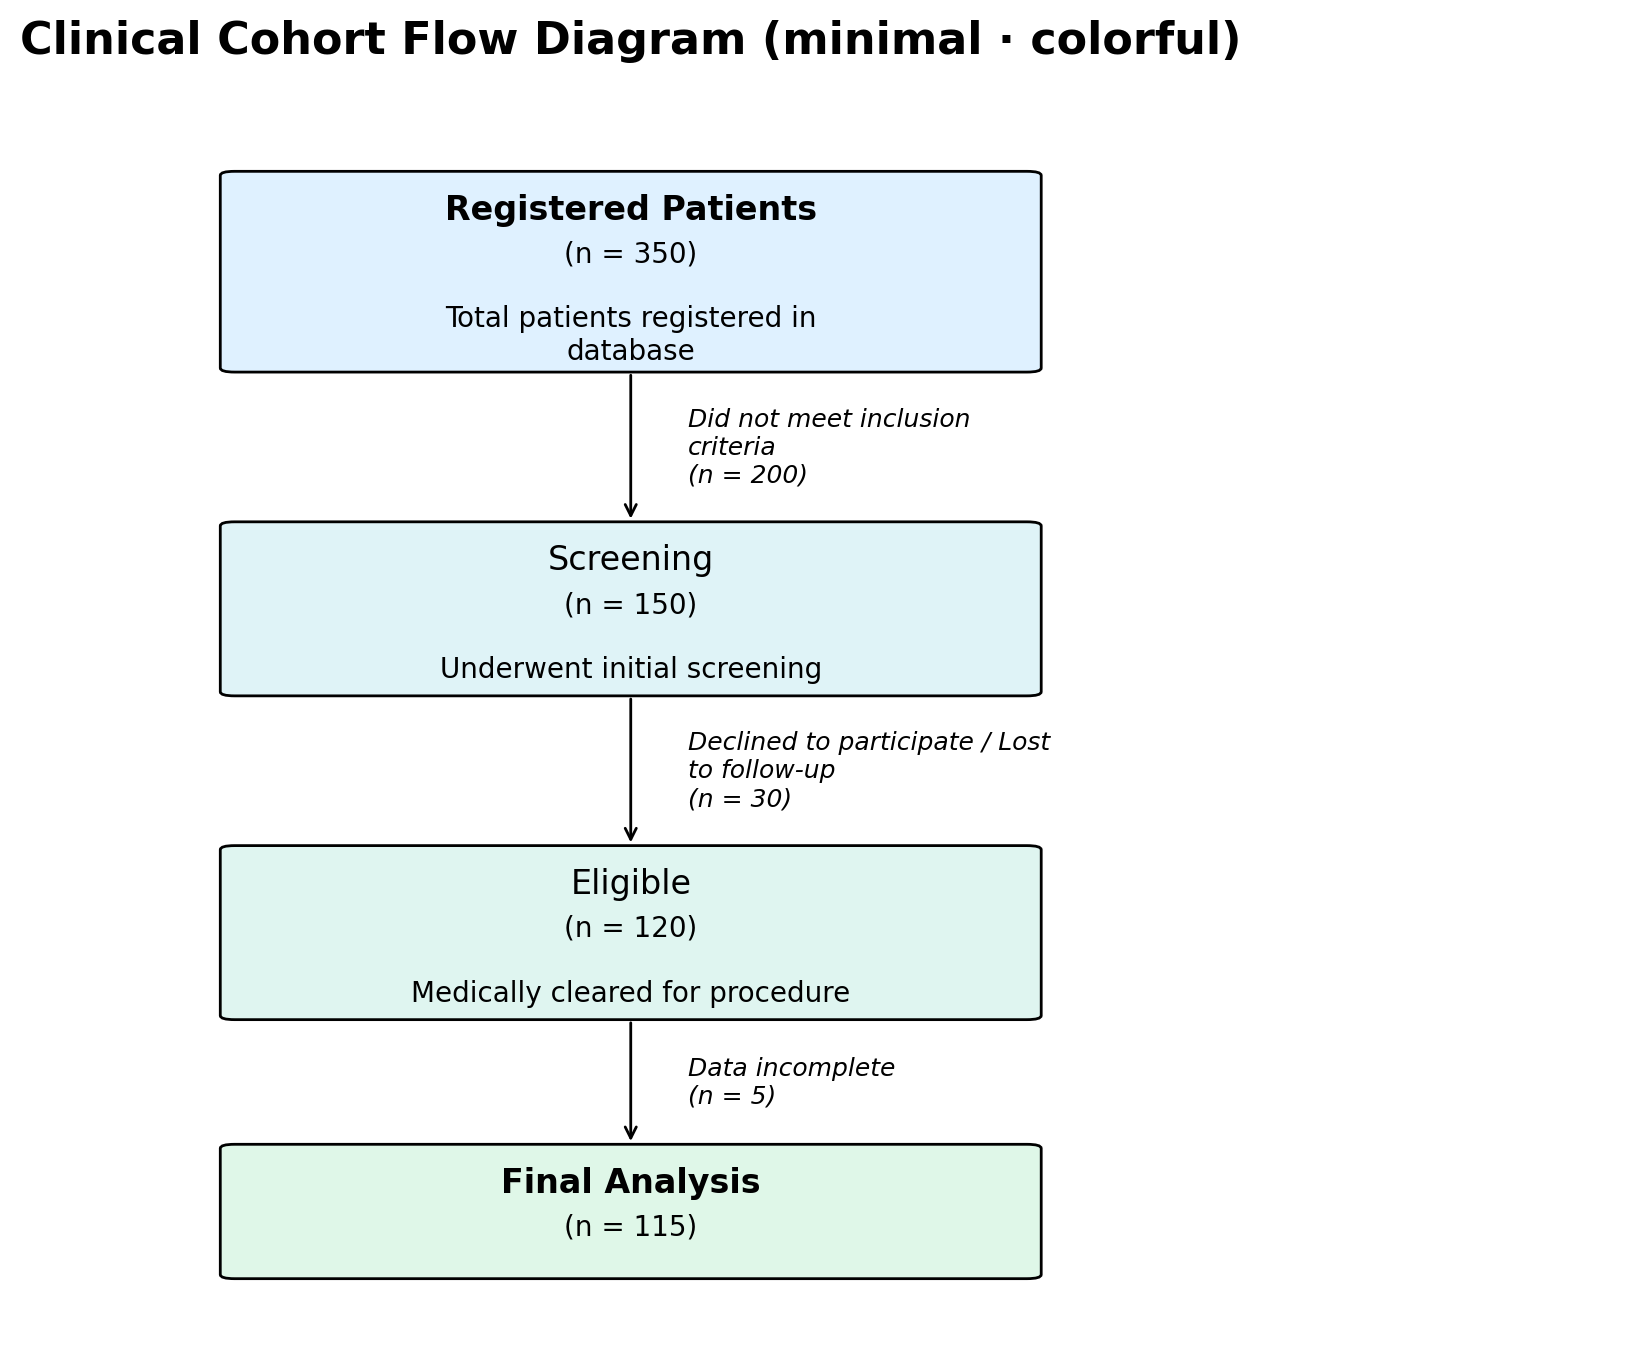
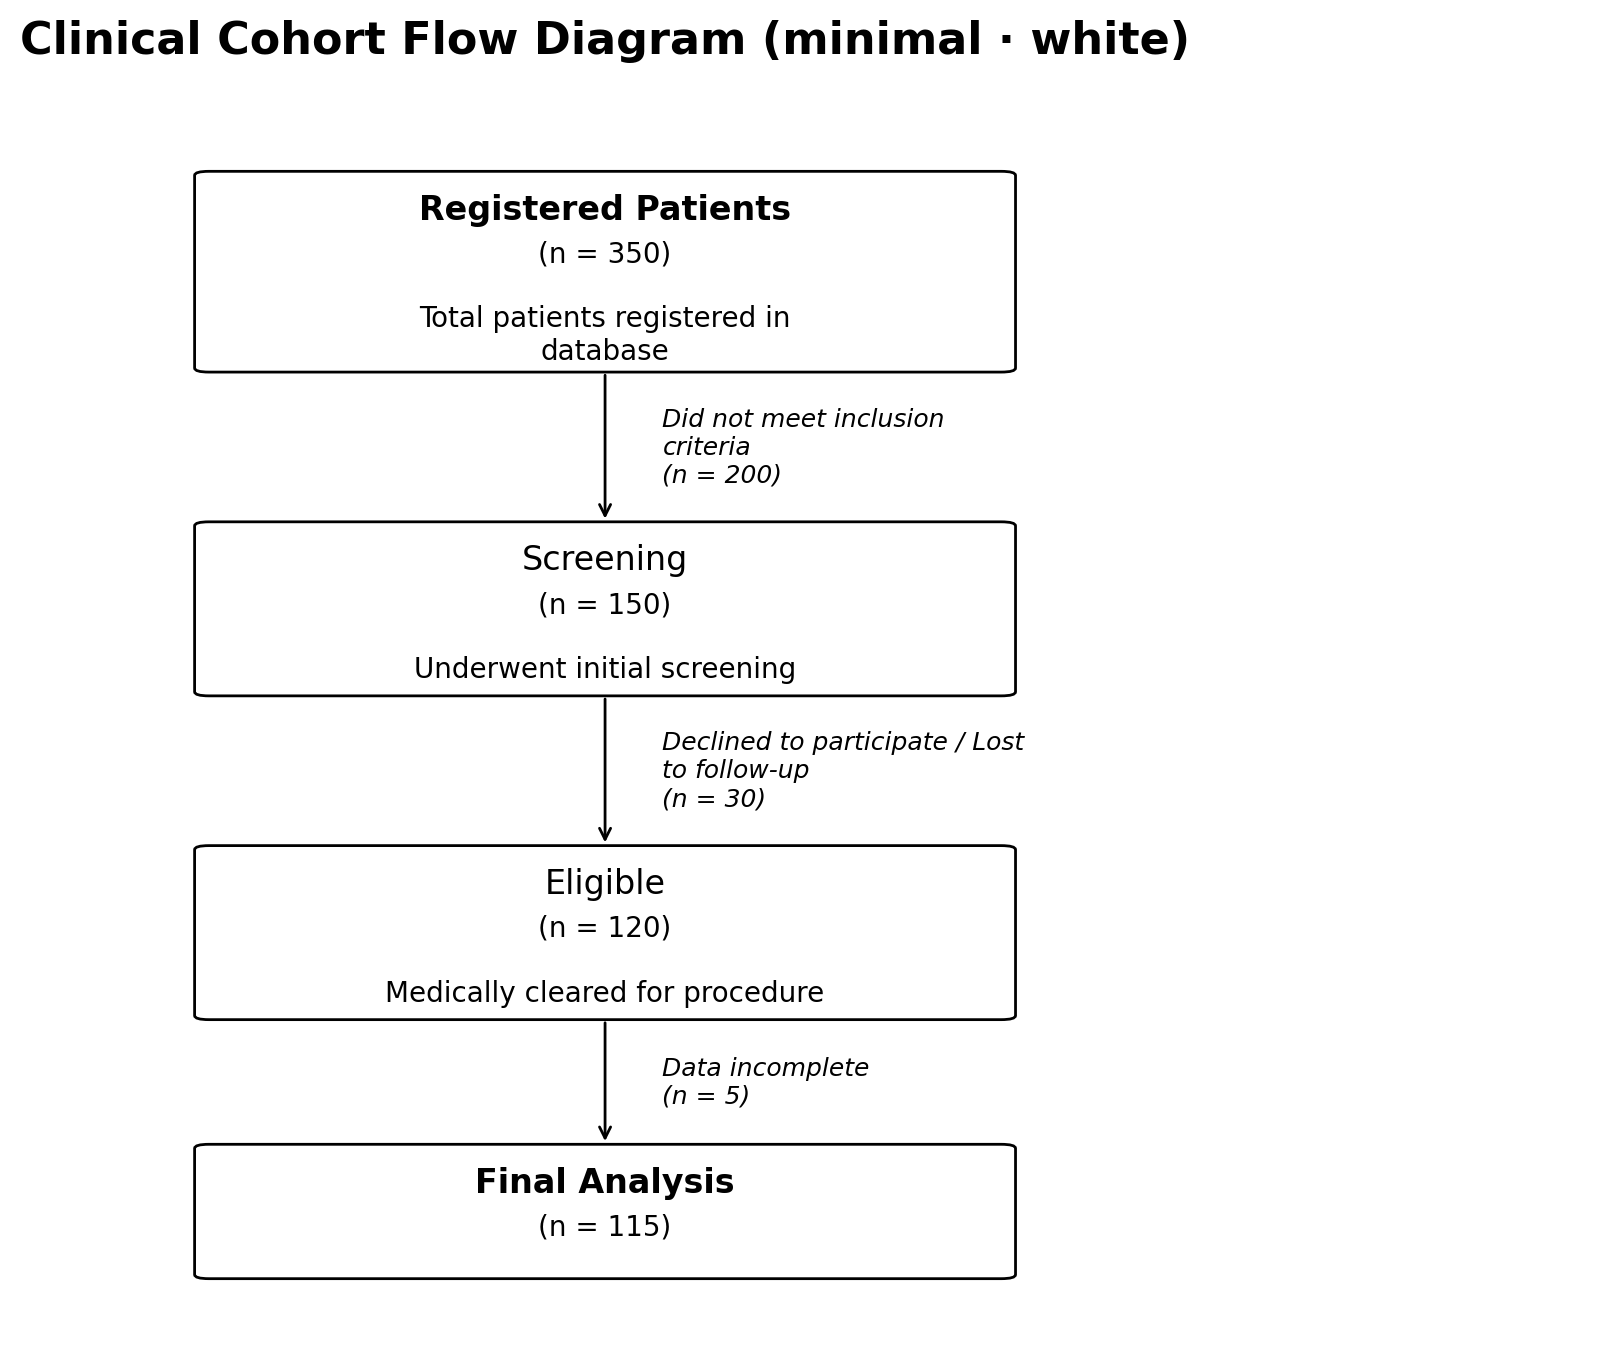
The "minimal" style replaces the side-card exclusion box with
italic side text and uses normal-weight headings by default. Per-node
"color" and "heading_fontweight" overrides let you either
highlight just the start and end nodes (white middle nodes) or fill
every node with a pastel gradient that mirrors the colorful
style:
Drawing into an Existing Axes#
If you want to embed a flow chart inside a subplot layout, pass an
existing Matplotlib axes via the ax parameter. The function will
draw into that axes instead of creating a new figure:
import matplotlib.pyplot as plt
from pycohortflow import plot_cfd

fig, axes = plt.subplots(1, 2, figsize=(20, 8))

plot_cfd(cohort_data, ax=axes[0], figure_title="White")
plot_cfd(cohort_data, ax=axes[1], style="colorful",
                         figure_title="Colorful")

plt.tight_layout()
plt.show()
When ax is provided the returned tuple is (ax.figure, ax), so the
caller keeps full control over the figure.
Saving to Disk#
Pass save_dir, img_name, and optionally save_format to write
the figure directly:
fig, ax = plot_cfd(
    cohort_data,
    save_dir="output",
    img_name="my_flow_chart",
    save_format=["png", "svg", "pdf"],
    figure_title="My Study",
)
Each format is written as a separate file inside the output/ directory.
Supported Export Formats#
Matplotlib supports many output formats. The most common ones are:
Format |
Extension |
Notes |
|---|---|---|
PNG |
|
Raster image, best for on-screen viewing and web use. |
SVG |
|
Scalable vector graphic, ideal for publications and web embedding. |
|
Vector format, commonly used for LaTeX / print workflows. |
|
PS |
|
PostScript, for legacy print pipelines. |
EPS |
|
Encapsulated PostScript, often required by journal submissions. |
JPEG |
|
Lossy raster format (not recommended for diagrams). |
TIFF |
|
High-quality raster, sometimes required by publishers. |
WebP |
|
Modern web raster format (requires Pillow). |
PGF |
|
PGF/TikZ vector format for direct LaTeX inclusion. |
Raw / RGBA |
|
Uncompressed pixel data. |
Pass any of these as a string or list to save_format:
save_format=["png", "svg", "pdf", "eps", "tiff"]
Data Format#
Every element in the data list is a dictionary with the following keys:
Key |
Required |
Description |
|---|---|---|
|
Yes |
Number of remaining participants at this step. |
|
No |
Title displayed inside the box (defaults to |
|
No |
Additional body text rendered below the title. |
|
No |
Label for the exclusion side-box (defaults to |
|
No |
Override colour for this node (hex string or Matplotlib colour name). |
|
No |
Override colour for the exclusion box. |
The N values must be non-increasing — each step should have the
same or fewer participants than the previous one.
Next Steps#
Customise the visual appearance using a TOML file — see Customise.
Explore the full Python API — see Python API.
Build diagrams without installing Python — try the Interactive Generator.