Customise#
Every visual aspect of the flow diagram — colours, fonts, spacing, box
geometry — is controlled by a TOML configuration file. The package ships
with three built-in styles (white, colorful, and minimal);
you only need to override the keys you want to change.
Built-in Styles#
Select a style via the style parameter:
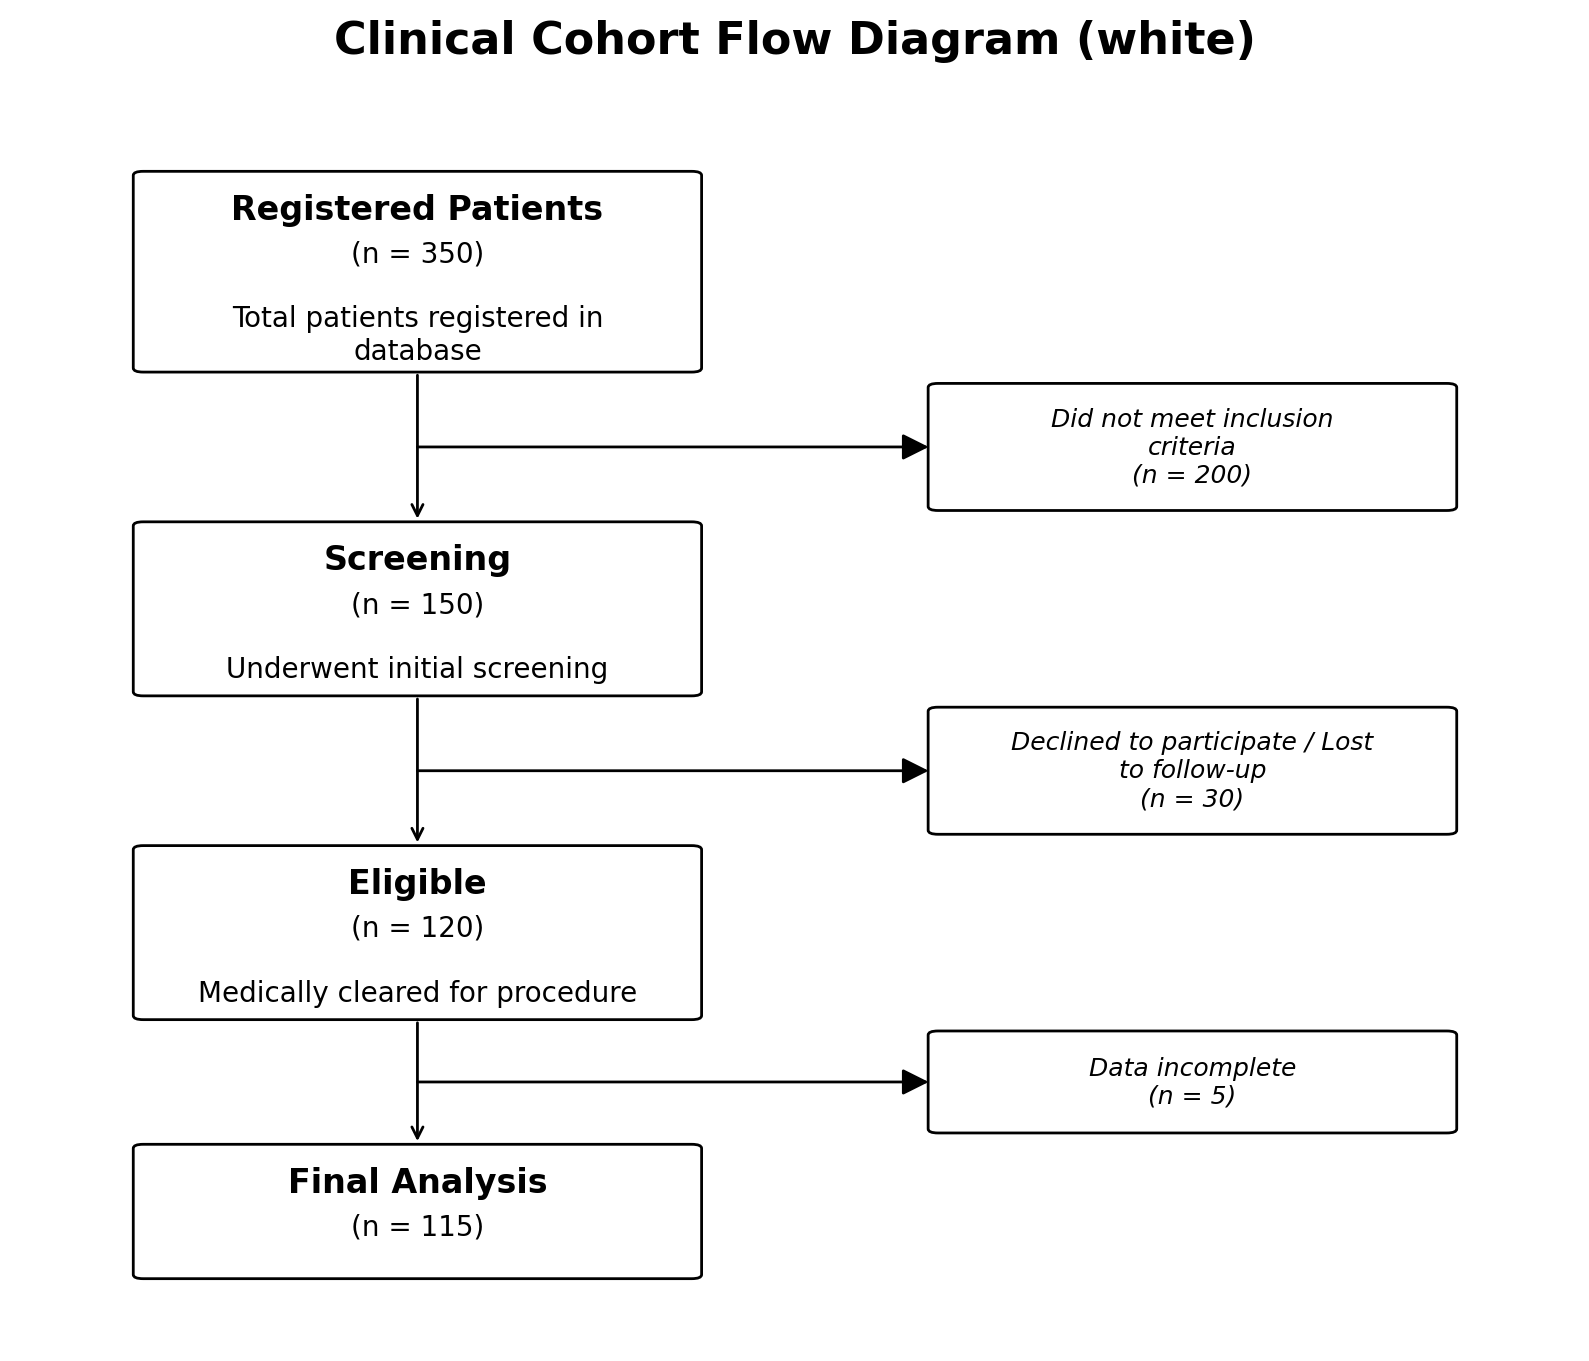
# Default: clean white boxes, no background colour
fig, ax = plot_cfd(data, style="white")
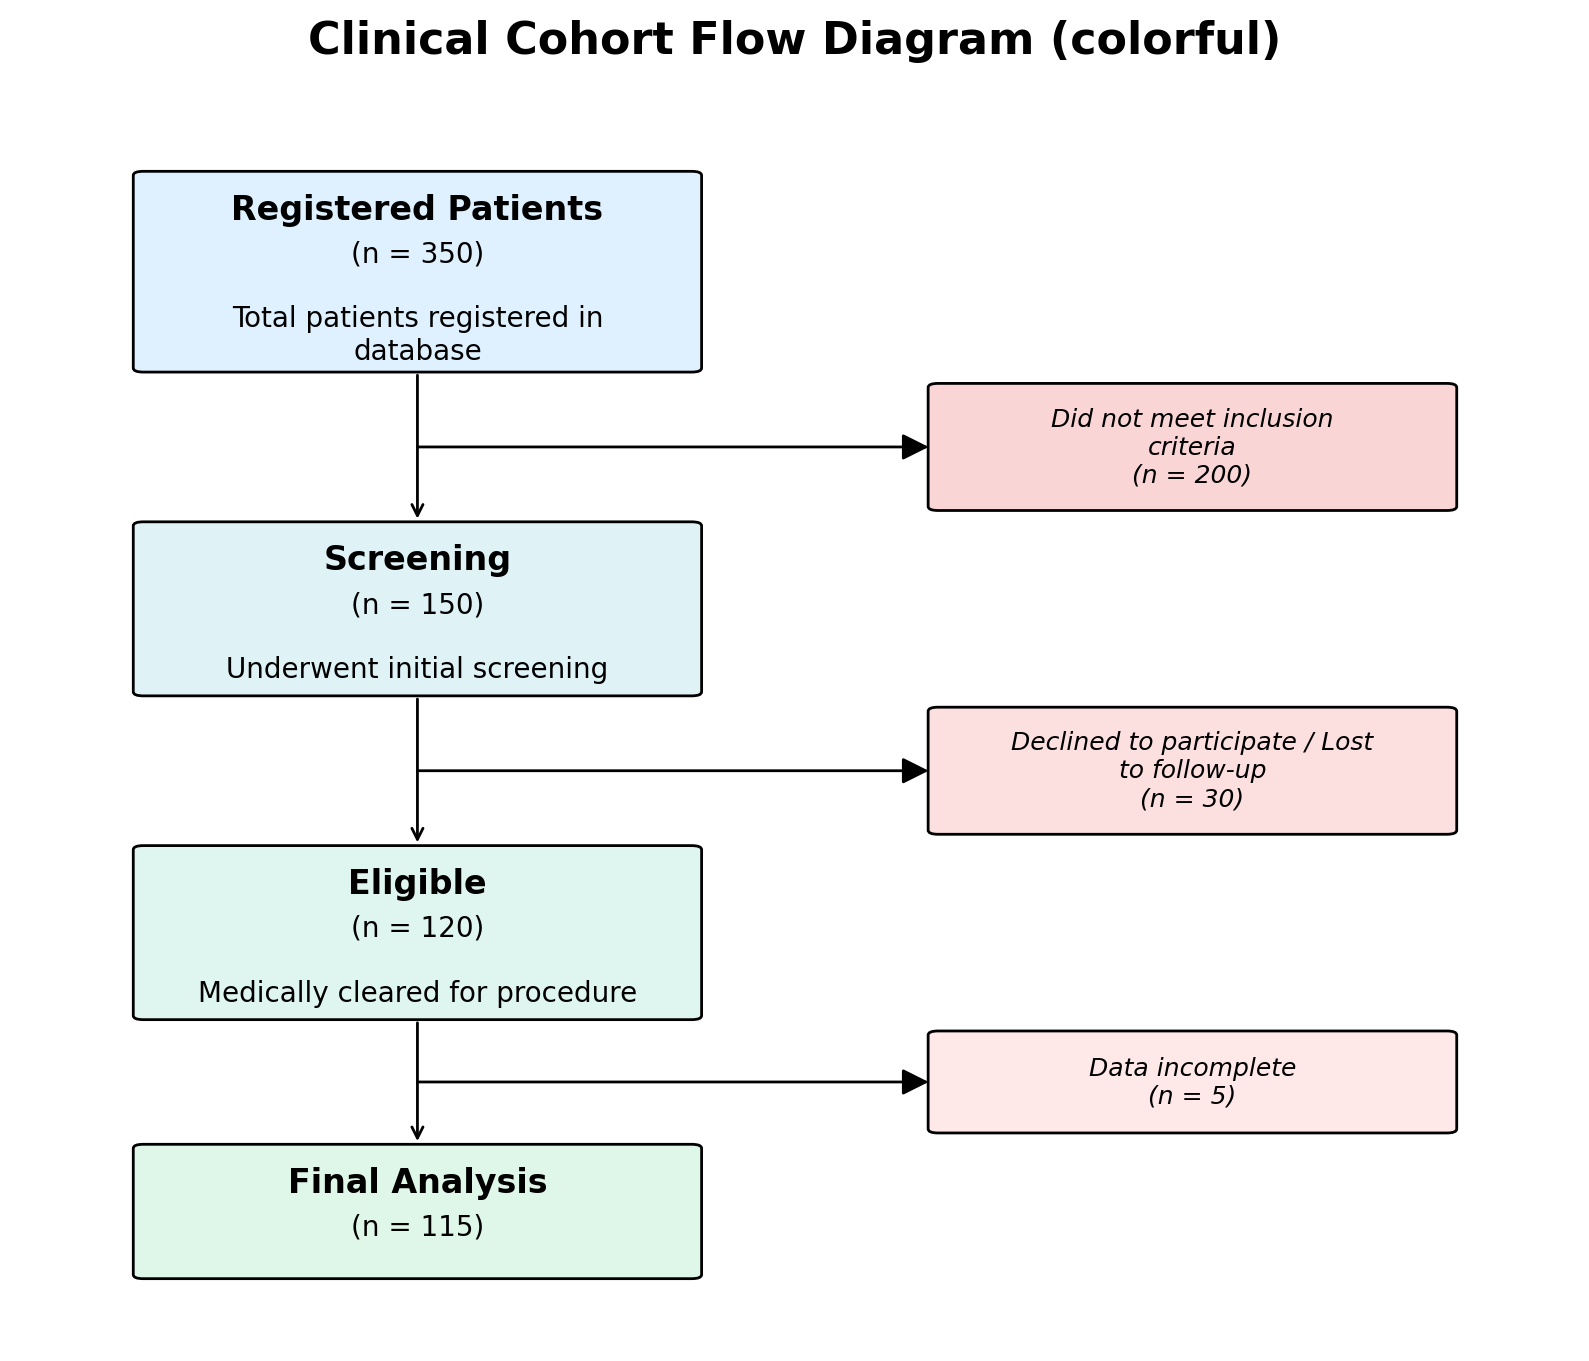
# Pastel gradient backgrounds
fig, ax = plot_cfd(data, style="colorful")
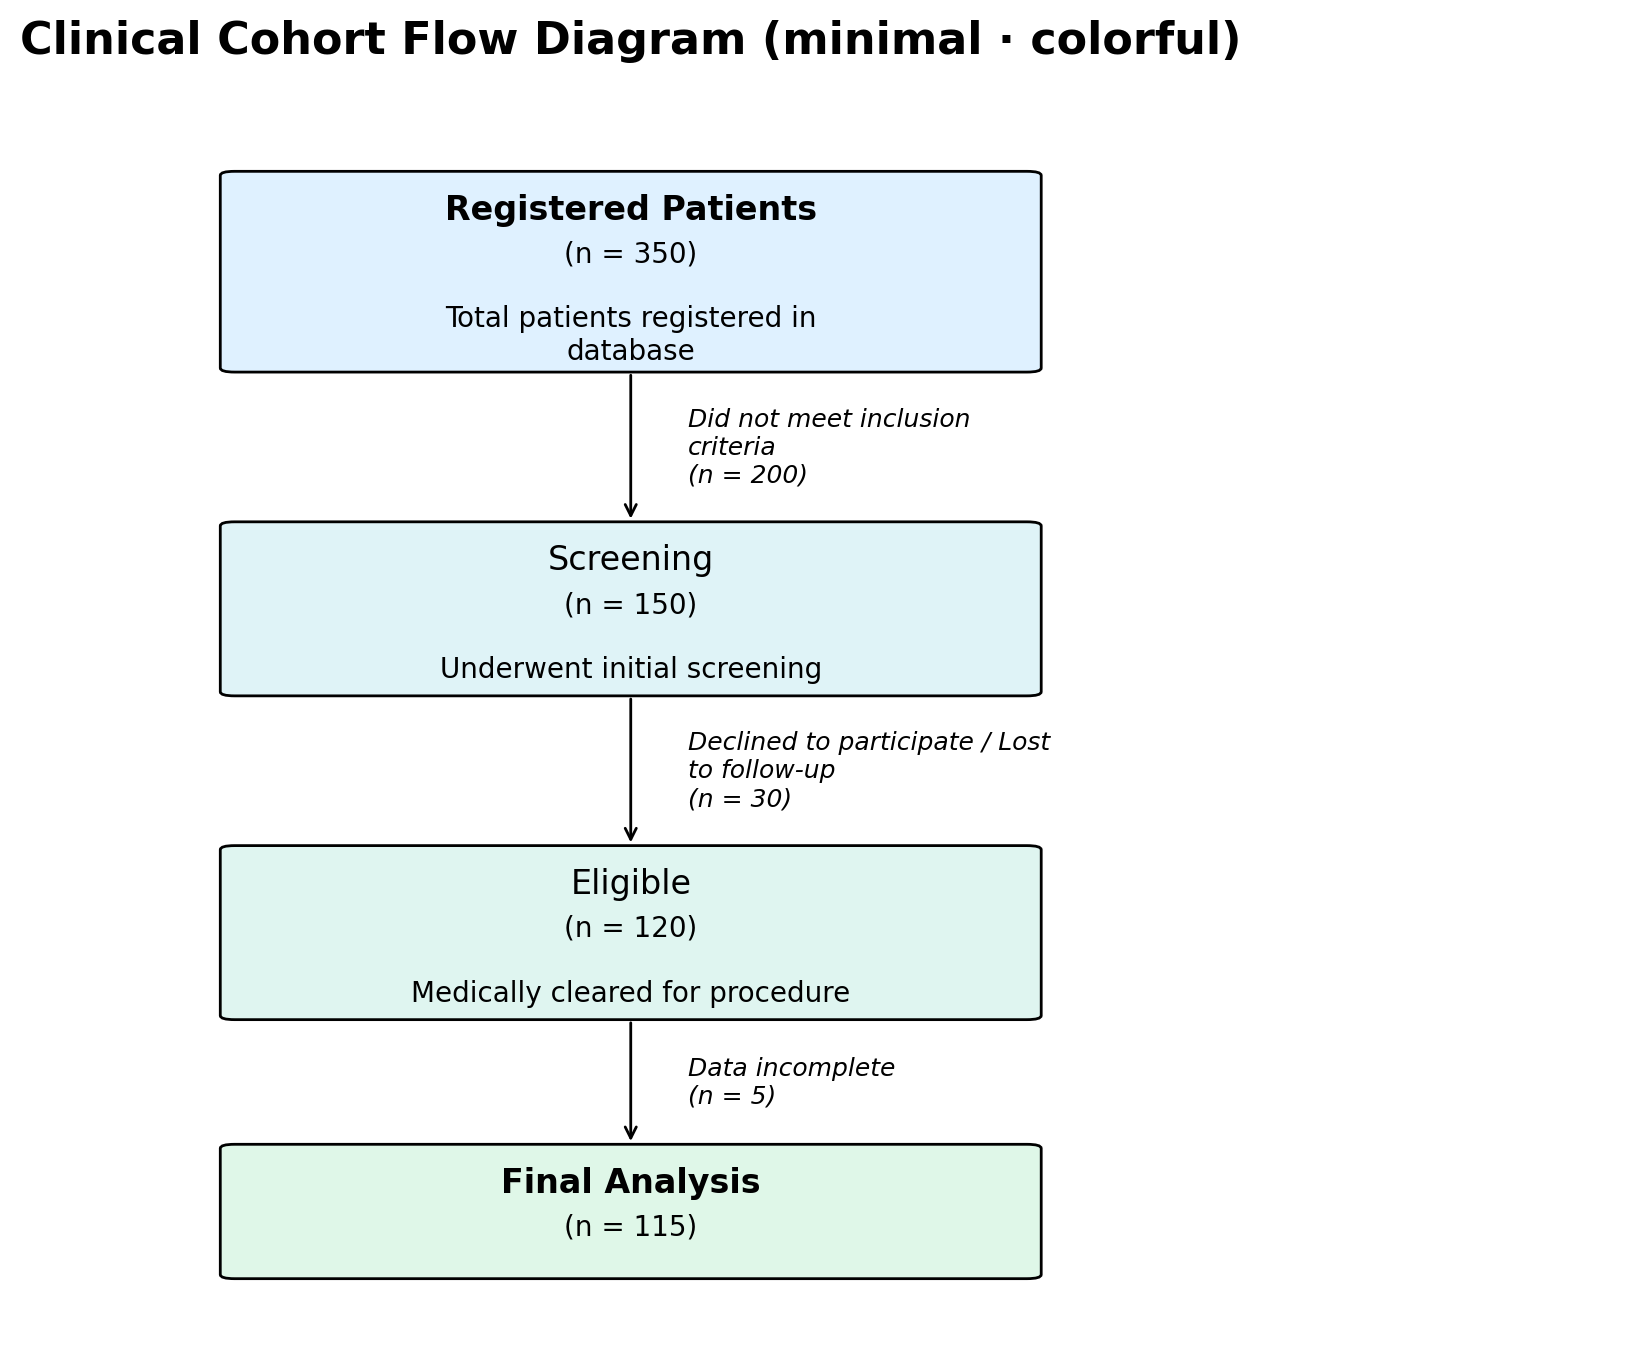
# Minimal: white boxes, normal-weight headings, italic side text
# (no exclusion box). Pair with per-node ``"color"`` overrides to
# highlight start/end nodes.
fig, ax = plot_cfd(data, style="minimal")
Using a Custom Style File#
Create a TOML file anywhere on disk, then pass its path when plotting:
fig, ax = plot_cfd(
    data,
    style="colorful",               # base style
    style_config_path="my_style.toml",  # overrides on top
)
Your file is merged on top of the chosen built-in style, so you only need to include the sections and keys you want to change.
Configuration Sections#
Below is the complete default configuration with explanations.
[figure] — Overall Figure#
[figure]
figsize_width = 12        # minimum figure width (inches)
figsize_height = 8        # minimum figure height (inches)
dpi = 200                 # resolution (dots per inch)
title_fontsize = 16       # figure title font size
title_fontweight = "bold" # figure title weight
title_pad = 20            # padding above the title (points)
[layout] — Spacing & Widths#
[layout]
main_title_width = 26          # character wrap width for box titles
main_text_width = 34           # character wrap width for body text
exclusion_text_width = 30      # character wrap width for exclusion text
main_box_width = 2.8           # main box width (data units)
exclusion_box_width = 2.6      # exclusion box width
base_gap = 0.8                 # minimum vertical gap between boxes
side_gap = 1.2                 # horizontal gap to exclusion box
top_margin = 0.8               # space above the first box
bottom_margin = 0.8            # space below the last box
x_padding = 0.6                # horizontal padding at canvas edges
[box_geometry] — Box Sizing#
[box_geometry]
padding = 0.52               # internal padding factor
title_line_height = 0.42     # vertical space per title line
body_line_height = 0.33      # vertical space per body line
title_body_gap = 0.16        # gap between title and body text
text_top_padding = 0.24      # space from box top to first line
min_main_height = 1.6        # minimum height of a main box
min_exclusion_height = 1.2   # minimum height of an exclusion box
clearance = 0.2              # extra clearance around exclusion boxes
corner_radius = 0.05         # rounded corner radius
pad_factor = 0.03            # FancyBboxPatch pad parameter
[text] — Font Sizes & Weight#
[text]
fontsize_title = 12          # box title font size
fontsize_main = 10           # box body font size
fontsize_exclusion = 9       # exclusion box font size
heading_fontweight = "bold"  # default weight for box headings
                             # ("bold" or "normal"; the "minimal"
                             # style sets this to "normal")
Per-node heading_fontweight override (e.g. {"heading": "Final
Cohort", "N": 60, "heading_fontweight": "bold"}) lets you re-bold
selected boxes when the style default is "normal" — useful for
highlighting the first and last steps in the minimal style.
[lines] — Connectors & Arrows#
[lines]
box_linewidth = 1           # box border width
connector_linewidth = 1     # arrow line width
arrow_mutation_scale = 20   # arrow-head size
junction_radius = 0.004     # radius of the junction dot
[colors] — Colour Gradient#
# "colorful" style defaults:
[colors]
allow_named_colors = true      # allow Matplotlib colour names
main_start = "#dff1ff"         # gradient start for main boxes
main_end = "#dff7e8"           # gradient end for main boxes
exclusion_start = "#f8cccc"    # gradient start for exclusion boxes
exclusion_end = "#fee8e8"      # gradient end for exclusion boxes
In the white style, all four colour values are "#ffffff".
[exclusion] — Exclusion Rendering Mode#
[exclusion]
mode = "box"   # "box" (default) draws a side-card with a horizontal
               # arrow and junction dot.  "text" renders the
               # exclusion description as plain italic text next to
               # the vertical arrow — no box, no junction, no
               # horizontal arrow.  Used by the ``minimal`` style.
Transparent Background#
For embedding diagrams in presentations or posters, use the
transparent option:
fig, ax = plot_cfd(data, transparent=True)
Minimal Override Example#
To simply increase the DPI and use darker exclusion colours, create a file like this:
[figure]
dpi = 300

[colors]
exclusion_start = "#ff9999"
exclusion_end = "#cc3333"
All other values remain at their defaults.
Ad-Hoc Overrides via Keyword Arguments#
A few settings can also be overridden directly in the function call without touching any file:
fig, ax = plot_cfd(
    data,
    dpi=300,
    figsize=(14, 10),
    main_palette=["#aec6cf", "#b5ead7", "#c7ceea"],
)
The priority order is: keyword arguments > custom TOML file > built-in style defaults.
Tip
The same TOML configuration format is supported by the Interactive Generator. Paste overrides into the “TOML overrides” field to preview style changes without writing any Python code.
Exporting for the Interactive Generator#
When a Python pipeline produces the cohort data programmatically (for
example as the output of an analysis step), you may want a non-Python
collaborator to view, tweak, or re-render the same diagram in the
Interactive Generator without installing Python.
Use pycohortflow.export() (or the convenience wrapper
pycohortflow.plot_and_export()) to produce a paste-ready
.cohort.json + .style.toml pair from your call.
from pycohortflow import plot_and_export

fig, ax, exp = plot_and_export(
    data,
    out_dir="export",
    name="study",
    style="colorful",
    figure_title="My Study",
    dpi=200,
    save_format=["png", "pdf"],
)
# Writes:
#   export/study.png            (figure)
#   export/study.pdf            (figure)
#   export/study.cohort.json    (paste into "Cohort data (JSON)")
#   export/study.style.toml     (paste into "TOML overrides")
In the browser:
Open the Interactive Generator.
Paste the contents of
study.cohort.jsoninto the Cohort data (JSON) textarea. The generator detects the envelope format and auto-populates the Figure title and Transparent background inputs from the_metablock.Paste the contents of
study.style.tomlinto the TOML overrides textarea. The full resolved style is written, so the Style dropdown selection no longer matters.The preview re-renders automatically; download as SVG / PNG / PDF.
JSON envelope#
The exported JSON wraps the data list in an envelope so per-call options round-trip too:
{
  "_meta": {
    "pycohortflow_version": "0.1.4",
    "exported_at": "2026-05-04T10:30:00+00:00",
    "figure_title": "My Study",
    "transparent": false
  },
  "data": [
    {"heading": "Registered", "N": 350},
    {"heading": "Final", "N": 100}
  ]
}
The browser-side parser also accepts a bare list (legacy form) so older exports continue to work.
Standalone export#
Use pycohortflow.export() directly when the figure is already
rendered or when you only need the JSON / TOML pair:
from pycohortflow import export

result = export(
    data,
    style="minimal",
    figure_title="My Study",
    out_dir="export",
    basename="study",
)
# result["cohort_json"]  → the JSON string
# result["style_toml"]   → the TOML string
# result["json_path"]    → Path to the written .cohort.json
# result["toml_path"]    → Path to the written .style.toml
Omit out_dir and basename to skip writing files; the strings
are still returned in the result dict.
Note
main_palette and exclusion_palette keyword overrides have no
TOML representation, so they are baked into the exported JSON as
per-node "color" / "exclusion_color" entries. Existing
per-node overrides take precedence (matching the behaviour of
pycohortflow.plot_cfd()).